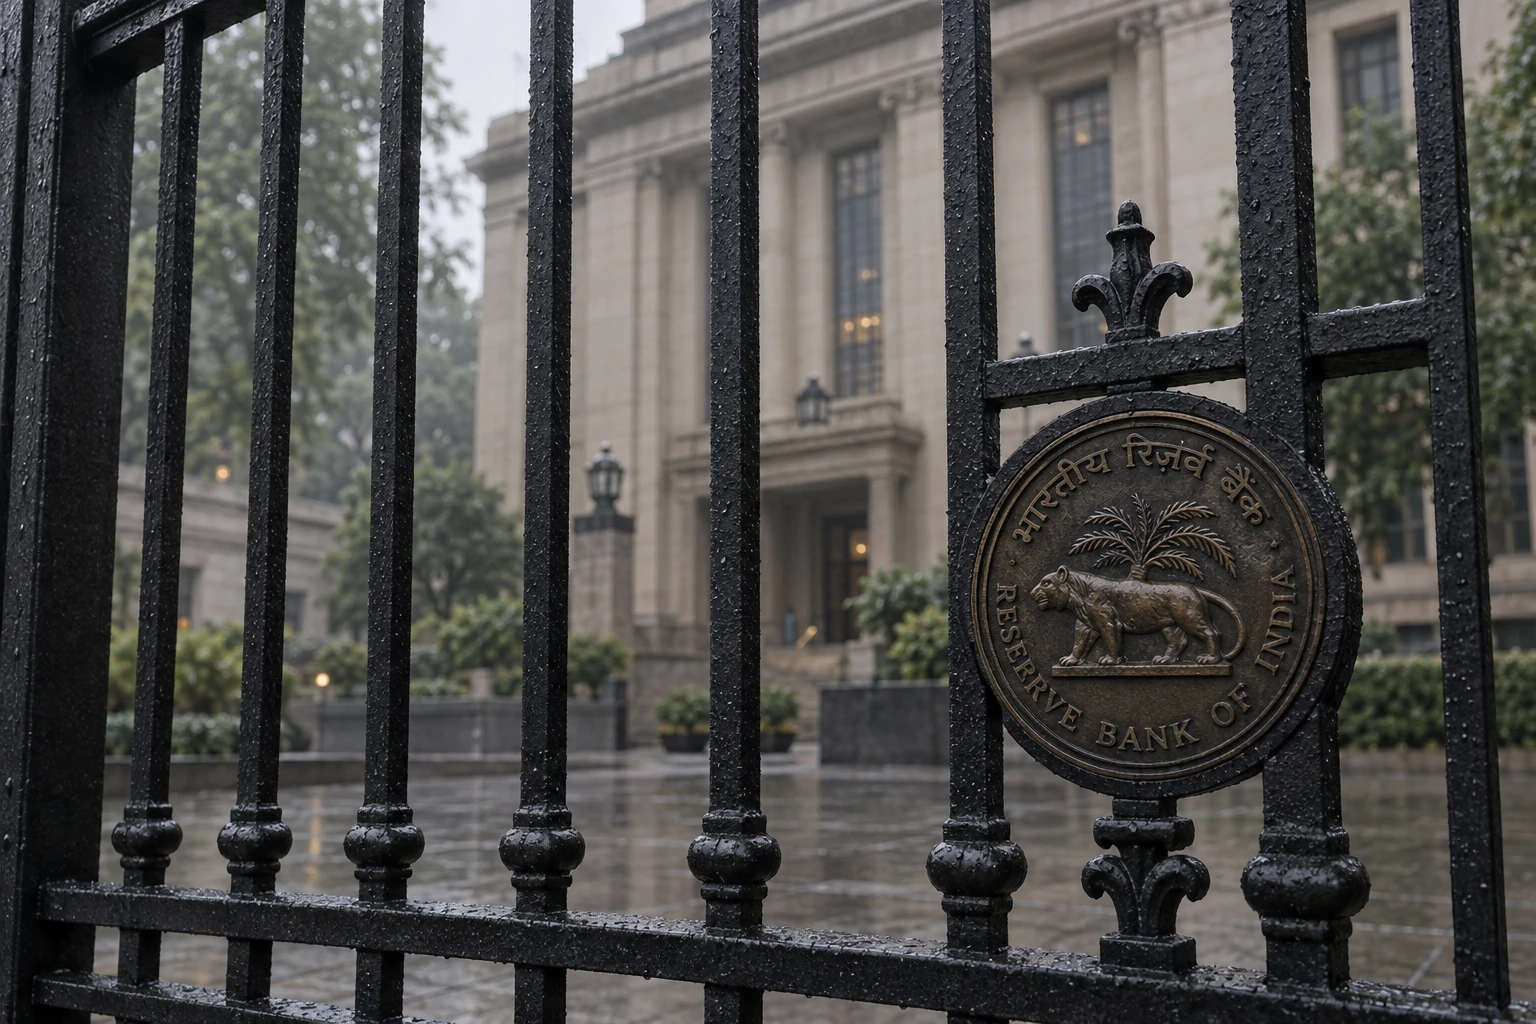
India's foreign-exchange reserves fell about $38 billion in the three weeks to 25 September, the largest three-week decline in the available record since December 2012. For institutions financing and investing in Indian companies, the exposure extends beyond businesses that buy directly from abroad: more than half of industry's import content reaches it through domestic suppliers.
Steel shows the connection between the currency and operating margins. Of the imported content in India's iron and steel output, 61% arrives through domestic suppliers and 48% is energy. Tata Steel, JSW Steel and Steel Authority of India report exports of 8.0%, 7.1% and 0.5% of sales. Their limited export share puts greater weight on procurement costs, pricing power and currency hedges when assessing their ability to absorb a weaker rupee.
Reserves stood at a record $785.7 billion on 4 September and at $747.6 billion on 25 September, a fall of 4.9%. The last week alone took $18.3 billion, the largest weekly decline in the available record since December 2012; the next-largest three-week fall was $30.1 billion, in March this year. The Reserve Bank of India (RBI) was selling dollars to support the rupee, Business Standard reported. Gold accounts for $5.1 billion of the decline, while changes in gold prices and the dollar value of other currencies also affect the reserve buffer.
The rupee weakened from 94.49 to 95.89 per dollar over the three weeks, with the latest observation at 95.99. Brent crude closed at $102.54 a barrel on 2 October. Together, a dearer dollar and oil above $100 put the rupee cost of energy at the centre of the margin outlook for import-dependent businesses.
Currency defence also connects to the cost of domestic funding. RBI spot dollar sales withdraw rupees from banks unless offset by other operations. Banks' surplus cash parked with the central bank fell from ₹11.16 lakh crore on 6 September to ₹4.85 lakh crore on 30 September. The government's one-year borrowing cost reached 6.18% at the 30 September auction, the highest since 2 April 2025. Since February 2020, smaller cash surpluses have coincided with overnight rates closer to, or higher relative to, the policy rate. For treasurers and lenders, the squeeze in available cash matters alongside the policy decision: tax flows and RBI liquidity operations can change funding conditions even without a move in the policy rate.
A weaker rupee raises the local-currency cost of imports when foreign-currency prices are unchanged. Direct purchases account for 46% of industry's import content; another 26% comes through the first layer of suppliers, 13% through the second and 14% further back. Imported energy—crude oil, gas, coal and petroleum products—accounts for 38% of the total. Eight industries carry at least twice the import content of the median industry. For a corporate loan book or equity portfolio, buying from an Indian supplier does not by itself remove currency exposure from the cost base.
Industry import exposure, 2023–24
Among 976 listed non-financial companies, the fifth with the greatest industry-based import exposure after allowing for reported exports accounts for 33% of combined revenue. The fifth with the strongest export offset accounts for 12%. Indian Oil Corp., with exports of 3.6% of sales, Bharat Petroleum Corp. (1.2%), NTPC and GAIL (India) (none) are among the largest in the first group. Tata Consultancy Services (94.1%), Infosys (97.4%) and Sun Pharmaceutical Industries (72.3%) are among the largest in the second.
The sharper credit question is where import exposure meets an already heavy interest bill. Forty-five companies are in both the most exposed fifth and the fifth with the highest interest burden: at least 39% of positive operating profit, or an operating loss, in the four quarters to June 2026. Higher input costs would leave these businesses with less room to absorb financing pressure. Five of the ten largest companies shown below are in electricity.
| Company, ten largest by revenue on both lists | Industry | Interest as a share of operating profit, four quarters to June 2026 | Exports as a share of sales, as filed |
|---|---|---|---|
| Tata Power | Electricity | 55% | 0.3% |
| JSW Energy | Electricity | 78% | 0.0% |
| Adani Green Energy | Electricity | 77% | 0.0% |
| CESC | Electricity | 42% | 0.0% |
| Ramco Cements | Cement and other non-metallic minerals | 64% | 0.2% |
| Reliance Power | Electricity | 85% | 0.0% |
| Bajaj Electricals | Electrical equipment | 47% | 2.3% |
| India Cements | Cement and other non-metallic minerals | 39% | 0.0% |
| Ola Electric Mobility | Transport equipment | operating loss | 0.0% |
| Tejas Networks | Communication equipment | operating loss | 16.0% |
Within electricity, fuel mix is crucial to that credit assessment. The sector average includes imported coal and gas, while a generator using neither has a different sensitivity. The industry ranking directs attention to the businesses where procurement, hedging and the ability to pass costs through deserve closer examination.
Foreign portfolio investors held $783.1 billion of Indian shares and bonds on 15 September, according to National Securities Depository Ltd. (NSDL). Financial services account for 27% of those holdings; healthcare and automobiles 7% each; capital goods and oil and gas 6% each; government bonds 5%. For an unhedged foreign investor, rupee depreciation lowers the dollar value of a holding even if its local price is unchanged. Portfolio exposure therefore has two dimensions: the effect on the company's economics and the currency translation of the investment itself.
The sector distribution shows where those two dimensions can diverge. Automobiles, capital goods, oil and gas, metals and power are more exposed through imported costs; healthcare and information technology have an export-receipt offset. In financial services, the immediate connection runs through banks' liquidity and interest rates. Since mid-July, the largest net foreign sales have been in telecom, power, capital goods, automobiles and consumer goods. A diversified sector allocation can still carry concentrated exposure to the same currency and funding pressures.
Previous reserve declines offer a range of policy and recovery outcomes. The available record since December 2012 contains nine episodes beginning with a fall of 2% or more within three weeks; the table follows each episode from peak to low. The rupee weakened in seven of the eight earlier episodes. Of the seven with a full six-month policy-rate observation, rates were higher in three, lower in three and unchanged in one; the eighth is still too recent. Reserves regained their earlier peak in all eight, taking between 4 and 53 weeks. Oil rose more than 10% in two of those episodes, as it has this time; rates were subsequently lower in one and unchanged in the other. The history makes the duration of funding pressure and the policy response separate questions for institutions.
| Reserves, peak to low | Fall | The rupee during the fall | Policy rate six months after the low | Weeks to regain the peak |
|---|---|---|---|---|
| 14 June to 5 July 2013 | 3.6% | weaker | higher | 21 |
| 6 to 20 March 2020 | 3.6% | weaker | lower | 9 |
| 24 June to 30 September 2022 | 10.2% | weaker | higher | 31 |
| 27 January to 24 February 2023 | 2.7% | weaker | higher | 4 |
| 27 September 2024 to 17 January 2025 | 11.5% | weaker | lower | 53 |
| 17 October to 7 November 2025 | 2.2% | weaker | lower | 11 |
| 27 February to 27 March 2026 | 5.6% | weaker | unchanged | 21 |
| 8 May to 26 June 2026 | 4.3% | little changed | not yet known | 6 |
| 4 to 25 September 2026 | 4.9% | weaker | not yet known | open |
Whether currency pressure reaches earnings depends on how businesses absorb it. Company results from 2018 to 2026 show no consistent tendency for material costs to rise faster against sales in import-heavy industries when the rupee weakens. The relationship between a weaker rupee and stronger exporter revenue appears only in the years to 2021, not in the later half of the period. That puts pricing power, procurement terms and hedging at the centre of company-level assessment. Reserves of $747.6 billion equal 10.6 months of merchandise imports at June's $70.8 billion pace, an external buffer alongside the pressure on corporate margins and cash flow.
What to watch
| Date | What happens |
|---|---|
| 7 October | the RBI's Monetary Policy Committee announces its rate decision. |
| 9 October | the RBI's reserves figure for the week to 2 October is due. |
Institutional perspective: The sector ranking provides a starting point for assessing margins, working capital and debt service. Industry averages locate the exposure; each company's fuel mix, hedging, foreign-currency debt and pricing power shape the outcome. Where interest bills already consume a large share of operating profit, the ability to absorb a higher import bill becomes especially consequential.